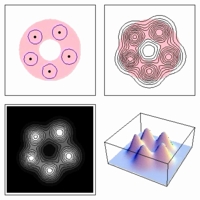
Annular region, five scalar covariances
(400 x 400) |
(high-quality, quicktime, 848 kb)
|

(lower-quality, mpeg, 700 kb)
|
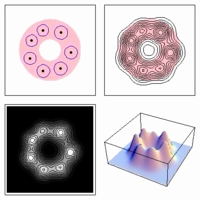
Annular region, seven scalar covariances
(400 x 400) |
(high-quality, quicktime, 724 kb)
|

(lower-quality, mpeg, 584 kb)
|
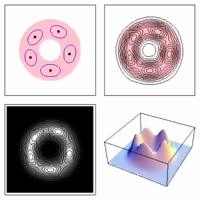
Annular region, five full covariance matrices
(400 x 400) |
(high-quality, quicktime, 464 kb)
|

(lower-quality, mpeg, 360 kb)
|
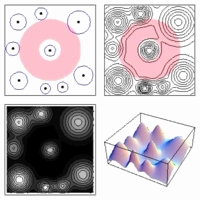
Anti-annular region, nine scalar covariances
(400 x 400) |
(high-quality, quicktime, 644 kb)
|

(lower-quality, mpeg, 540 kb)
|
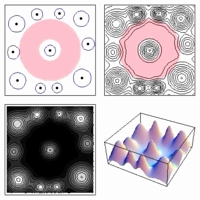
Anti-annular region, 11 scalar covariances
(400 x 400) |
(high-quality, quicktime, 756 kb)
|

(lower-quality, mpeg, 604 kb)
|
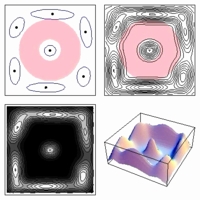
Anti-annular region, seven full covariance matrices
(400 x 400) |
(high-quality, quicktime, 572 kb)
|

(lower-quality, mpeg, 492 kb)
|
Anti-annular region, nine full covariance matrices
(400 x 400) |

(high-quality, quicktime, 808 kb)
|

(lower-quality, mpeg, 684 kb)
|
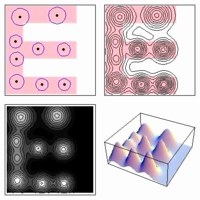
E-shaped polygonal region, nine scalar covariances (example #1)
(400 x 400) |
(high-quality, quicktime, 532 kb)
|

(lower-quality, mpeg, 440 kb)
|
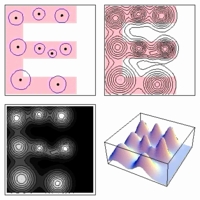
E-shaped polygonal region, nine scalar covariances (example #2)
(400 x 400) |
(high-quality, quicktime, 1020 kb)
|

(lower-quality, mpeg, 836 kb)
|
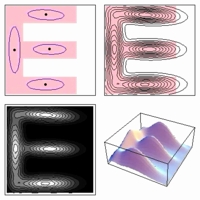
E-shaped polygonal region, four full covariance matrices
(400 x 400) |
(high-quality, quicktime, 668 kb)
|

(lower-quality, mpeg, 556 kb)
|
Anti-E-shaped polygonal region, eight scalar covariances (example #1)
(400 x 400) |

(high-quality, quicktime, 608 kb)
|

(lower-quality, mpeg, 492 kb)
|
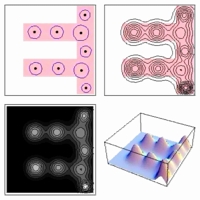
Anti-E-shaped polygonal region, eight scalar covariances (example #2)
(400 x 400) |
(high-quality, quicktime, 480 kb)
|

(lower-quality, mpeg, 396 kb)
|
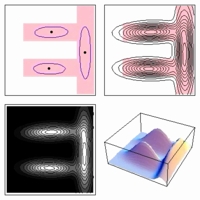
Anti-E-shaped polygonal region, three full covariance matrices (example #2)
(400 x 400) |
(high-quality, quicktime, 1168 kb)
|

(lower-quality, mpeg, 1052 kb)
|