![ImageObject[m_, size_:1, max_:255, min_:0] := Module[{sz, dimx, dimy, cf}, If[ ... d[sz * dimy]}, PlotRange {{0, dimx}, {0, dimy}}, AspectRatioAutomatic] ] ;](../HTMLFiles/index_6.gif)
Basic image processing
Basic image display and conversion
Matrix to Mathematica Image object
Display Mathematica image object
![]()
Read image file to matrix
![]()
Save matrix to image file
![]()
Color to grayscale
![]()
Grayscale to color (data conversion)
![]()
Image scaling
Scale one image channel to new dimensions ![]()
![ScaleOneChannel[mc_, {xn_, yn_}] := Module[{xo, yo, f1, f2}, {yo, xo} = mc // ... ; Round[Table[f2[y, x], {y, 1, yo, (yo - 1)/(yn - 1)}, {x, 1, xo, (xo - 1)/(xn - 1)}]] ] ;](../HTMLFiles/index_13.gif)
Scale image to new dimensions ![]()
![ScaleImage[m_, {xn_, yn_}] := Module[{r, g, b}, If[MatrixQ[m], ScaleOn ... ]] &, m, {2}], {xn, yn}] ; Transpose /@ ({r, g, b} // Transpose) ] ] ;](../HTMLFiles/index_15.gif)
Scale image by a factor α such that ![]()
![ScaleImage[m_, fac_] := Module[{x, y}, If[MatrixQ[m], {y, x} = Dimens ... x} = Drop[Dimensions[m], -1] ; ] ; ScaleImage[m, Round[fac * {x, y}]] ] ;](../HTMLFiles/index_17.gif)
Simple image creation
Create single color image
![]()
Clip single pixel/channel image values
![]()
Create Gaussian noise image
![GaussianNoiseImage[{μ_, σ_}, {dimx_, dimy_}, max_:255, min_:0] := Module[{m, ... n[μ, σ]], {dimx}, {dimy}] + offset ; Map[Clip[#, max] &, m, {2}] ] ;](../HTMLFiles/index_20.gif)
Histogram modifications
Support function for histogram plotting
![HistogramListPlot[data_, color_:Black, opts___] := Module[{g1}, g1 = Line[{{#[[1]], 0}, {#[[1]], #[[2]]}}] & /@ data ; Show[Graphics[{color, g1}], opts] ] ;](../HTMLFiles/index_21.gif)
Plot image histogram
![ShowHistogram[m_, max_:255, opts___] := Module[{mi, vals, histogram}, mi = Rou ... t[{vals, histogram} // Transpose, Blue, FrameTrue, PlotRangeAll, opts] ] ;](../HTMLFiles/index_22.gif)
Histogram equalization
![HistogramEqualization[m_, max_:255] := Module[{mi, histogram, step1, map}, mi ... #62371;map = Round[step1/Last[step1] * max] ; Map[map[[# + 1]] &, mi, {2}] ] ;](../HTMLFiles/index_23.gif)
Histogram stretch
![HistogramStretch[m_, min_:0, max_:255] := Module[{imin, imax}, imin = Min[m] ; ... x = Max[m] ; Map[((# - imin)/(imax - imin) * (max - min) + min) &, m, {2}] ] ;](../HTMLFiles/index_24.gif)
Histogram slide
![]()
Pixel modifications (apply function to individual pixels)
Gray scale: ![]() such that
such that ![]()
Color: ![]() such that
such that ![]()
![]()
2D convolution with masks
Mask operators
Smoothing
![]()
![GaussianFilter[n_, σ_:1] := Module[{nc, gf1}, nc = (n - 1)/2 ; gf ... /(2σ^2)], {x, 0, n - 1}, {y, 0, n - 1}] // N ; gf1/(Plus @@ Flatten[gf1]) ] ;](../HTMLFiles/index_32.gif)
Edges
![]()
![]()
![]()
Texture example
(L = Level, E = Edge, S = Spot, R = Ripple) TexureMasks: (EL, RL, ES, RR, SL, EE, ER, SR)
![L5T[] := {1, 4, 6, 4, 1} ; E5T[] := {-1, -2, 0, 2, 1} ; S5T[] := {-1, 0, 2, 0, -1} ; R5T[] := ... Outer[Times, S5T[], R5T[]] ; R5S5[] := Outer[Times, R5T[], S5T[]] ; SR[] := (S5R5[] + R5S5[])/2 ;](../HTMLFiles/index_36.gif)
2D convolution
Pad image with border rows so that 2D convolution does not shrink image
![PadImage[m_] := Module[{mout}, mout = Join[{First[m]}, m] ; mout = Joi ... rst[mout]}, mout] ; mout = Join[mout, {Last[mout]}] ; mout // Transpose] ;](../HTMLFiles/index_37.gif)
2D convolution of a single channel
![MaskOneChannel[mc_, kernel_] := Module[{m2}, m2 = Nest[PadImage, mc, (First[Dimensions[kernel]] - 1)/2] ; Round[Abs[ListConvolve[kernel, m2]]] ] ;](../HTMLFiles/index_38.gif)
2D convolution of an image w/kernel (image dimensions unaffected for square masks with odd-numbered dimensions)
![Mask[m_, kernel_] := Module[{r, g, b}, If[MatrixQ[m], MaskOneChannel[m ... [3]] &, m, {2}], kernel] ; Transpose /@ ({r, g, b} // Transpose) ] ] ;](../HTMLFiles/index_39.gif)
Median filtering
Filter one channel with (2n+1) x (2n+1) median filter
![MedianFilterOneChannel[mc_, n_] := Module[{ker, m1, m2}, ker = Table[0, {2 * n ... olve[ker, m1, {-1, 1}, 0, Plus, List] ; Map[Median[Flatten[#]] &, m2, {2}] ] ;](../HTMLFiles/index_40.gif)
Filter image with (2n+1) x (2n+1) median filter
![MedianFilter[m_, n_] := Module[{r, g, b}, If[MatrixQ[m], MedianFilterO ... ap[#[[3]] &, m, {2}], n] ; Transpose /@ ({r, g, b} // Transpose) ] ] ;](../HTMLFiles/index_41.gif)
Image thresholding
Simple thresholding
![ThresholdImage[m_, t_, max_:255] := Module[{m1}, m1 = If[MatrixQ[m], m, ColorToGrayScale[m]] ; Map[If[# < t, 0, max] &, m1, {2}] ] ;](../HTMLFiles/index_42.gif)
Gaussian thresholding (defined only for color images)
Mahalanobis distance from point to Gaussian distribution
![]()
Gaussian threshold an image
![GaussianThresholdImage[m_, t_, {μ_, Σ_}, max_:255] := Module[{Σi}, > ... #931;] ; Map[If[Mahalanobis[#, μ, Σi] > t, 0, max] &, m, {2}] ] ;](../HTMLFiles/index_44.gif)
Create Gaussian distance image
![GaussianDistanceImage[m_, μ_, Σ_] := Module[{Σi}, Σi = Inverse[Σ] ; Map[Mahalanobis[#, μ, Σi] &, m, {2}] ] ;](../HTMLFiles/index_45.gif)
Hough transform (straight lines)
Hough transform helper function
From binary image, generate a sorted list of scaled line parameters
![RowBox[{RowBox[{HoughEngine[mb_, n_: {100, 100}], :=, , RowBox[{Module, [, RowBox[{{ep ... 961;}] & /@ ep, ;, , Reverse[Sort[Frequencies[Join @@ ha1]]]}]}], , ]}]}], ;}]](../HTMLFiles/index_47.gif)
From binary image, generate Hough accumulator matrix
![HoughAccumulator[mb_, n_: {100, 100}] := Module[{tmp, ha}, tmp = HoughEngine[m ... , {n[[2]]}, {n[[1]]}] ; Fold[ReplacePart[#1, #2[[1]], #2[[2]]] &, ha, tmp] ] ;](../HTMLFiles/index_48.gif)
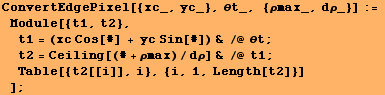
From binary image, returns the ![]() parameters for the top
parameters for the top ![]() , where
, where ![]()
![RowBox[{RowBox[{StraightLines[mb_, nlines_:1, n_: {100, 100}], :=, , RowBox[{Module, [ ... 960;/nθ} & /@ Take[Last /@ HoughEngine[mb, n], {1, nlines}] //N}]}], , ]}]}], ;}]](../HTMLFiles/index_52.gif)
Visualize detected straight lines over some image
![ShowStraightLines[m_, sl_, opts___] := Module[{xdim, ydim, g1}, xdim = Dimensi ... nIdentity] ; Show[g2, g1, DisplayFunction$DisplayFunction, opts] ]](../HTMLFiles/index_53.gif)
Visualize Hough accumulator
![ShowHoughAccumulator[m_, ha_, opts___] := Module[{ρmax}, ρmax = Sqrt ... MeshRange {{0, π}, {-ρmax, ρmax}}, PlotRangeAll, opts] ] ;](../HTMLFiles/index_54.gif)
Blob finding ("Connected Component Labeling")
Identify foreground neighbors of pixel (x, y) in image
![]()
First pass of blob finding algorithm
![BlobPass1[mc_] := Module[{d1, m2, m3, label, nzn, new}, d1 = Dimensions[mc] ; ... 2}, {d1[[1]] + 1, d1[[2]] + 1}] ; Map[If[#0, #, # - 1] &, m3, {2}] ] ;](../HTMLFiles/index_56.gif)
Unify adjacencies of labels after first pass of blob finding algorithm: support functions
![]()
![]()
Second pass of blob finding algorithm
![BlobPass2[mc_] := Module[{tmp1, tmp2, tmp3, tmp4}, tmp1 = ListConvolve[{{0, 0} ... PartialAdjacency, Union[DeleteCases[tmp3, Null]]] ; mc /. Flatten[Union[tmp4]] ] ;](../HTMLFiles/index_59.gif)
Label all blobs with unique label in a binary image
![]()
Count the number of blobs in a labeled blob image (after BlobFind[ ])
![]()
Eliminate all but the largest blob from a labeled blob image (after BlobFind[ ])
![KeepLargestBlob[mb_] := Module[{tmp1}, tmp1 = Last /@ Drop[Reverse[Sort[Frequencies[DeleteCases[mb // Flatten, 0]]]], 1] ; mb /.((#0) & /@ tmp1) ] ;](../HTMLFiles/index_62.gif)
Display a blob image with different random color assigned to each blob
![BlobImage[mb_] := Module[{levels, colors}, levels = Drop[Sort[Union[Flatten[mb ... Integer, {50, 255}], Random[Integer, {50, 255}]}, {i, 1, Length[levels]}]] ; mb/.colors] ;](../HTMLFiles/index_63.gif)
Morphological operators for binary images
Dilation
![Dilation[mc_, kernel_, max_:255] := Module[{m2, d1, d2}, d1 = Dimensions[mc] ; ... 1 + 2 * d2] ; ListConvolve[kernel, m2, {-1, 1}, 0, BitAnd, Max] /. 1max] ;](../HTMLFiles/index_64.gif)
Erosion
![Erosion[mc_, kernel_, max_:255] := Module[{m2, d1, d2}, d1 = Dimensions[mc] ; ... elate[kernel, m2, {1, -1}, 0, BitOr[BitAnd[#1, #2], 1 - #1] &, Min] /. 1max] ;](../HTMLFiles/index_65.gif)
Closing
![]()
Opening
![]()
Created by Mathematica (February 16, 2004)